
Lumen
A revenue-analytics dashboard for subscription businesses.
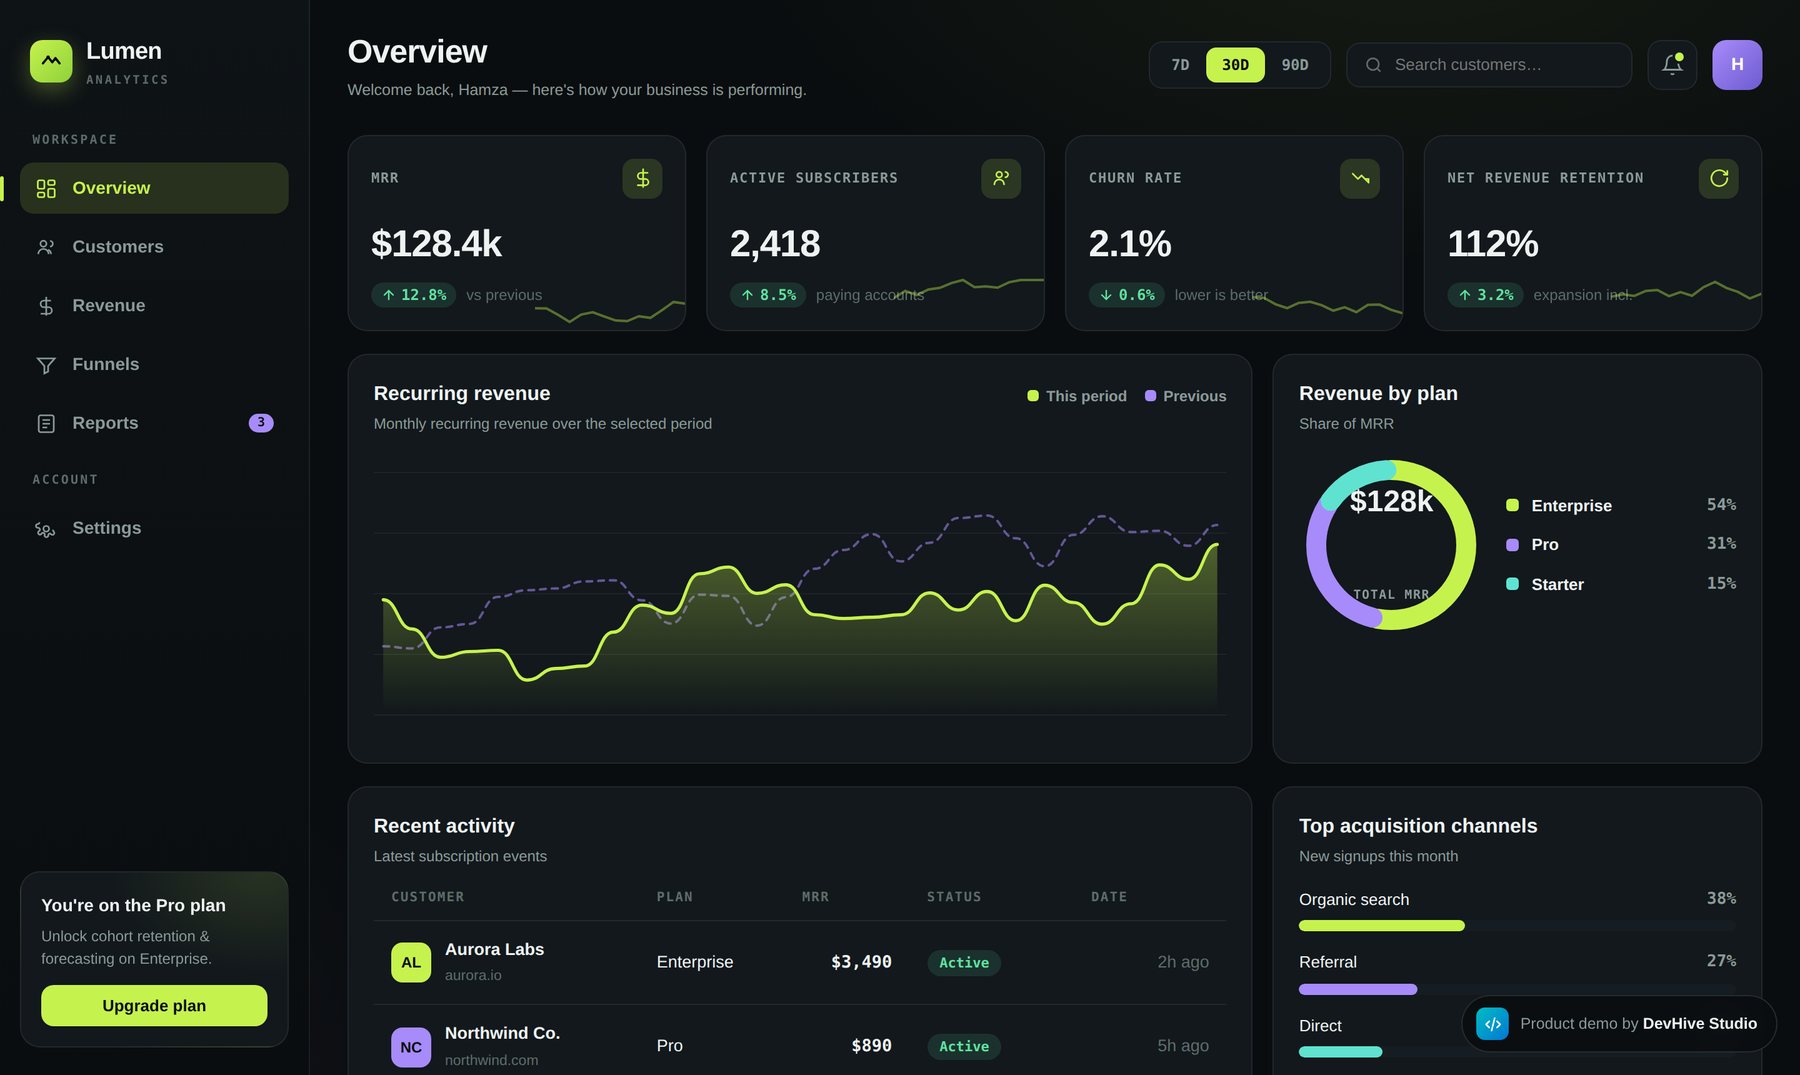
Overview
Lumen is a product demo we built to show how we design and engineer SaaS analytics dashboards. It turns raw subscription data into a clear story — revenue, retention and growth — in an interface that feels fast and effortless.
Everything is interactive: switch the date range and the charts recompute, hover the revenue graph for exact figures, and watch the KPIs animate in. It's a front-end concept built on sample data that mirrors how we'd build the real thing on top of your numbers.
What it does
Live KPI cards
MRR, active subscribers, churn and net revenue retention with trend deltas and sparklines.
Interactive revenue chart
Animated area chart with previous-period comparison and hover tooltips.
Date-range controls
7 / 30 / 90-day toggles recompute the whole view instantly.
Plan & channel breakdowns
Donut and bar visualisations for revenue by plan and acquisition channel.
Why we built it
Subscription businesses live and die by a handful of numbers — MRR, churn, retention, growth — yet those numbers are usually buried across billing tools and spreadsheets. By the time someone pulls them together, they're already out of date.
Lumen is our answer to that: a demo that shows how we turn raw subscription data into a single, fast, beautiful place to read the health of a business at a glance. The purpose is to prove that analytics tooling can feel effortless instead of intimidating.
The problem
Key SaaS metrics scattered across tools — slow to gather and hard to read.
What it does
Live KPI cards, an interactive revenue chart and date-range controls over sample data.
Why it matters
Decision-ready clarity: the state of the business in one glance, always current.
How we built it
Define the metrics that matter
We focused on the numbers subscription teams actually act on — MRR, churn, NRR and growth — instead of vanity stats.
Design for a glance
A calm, high-contrast dashboard where the most important figures read instantly, with detail a hover away.
Make it interactive
Date-range toggles recompute the whole view; charts animate and respond so the data feels alive.
Ship it live
Built as a real, hosted front-end on sample data — a true-to-life preview of the production product.
Want something like Lumen?
We can design and build it for your business.
